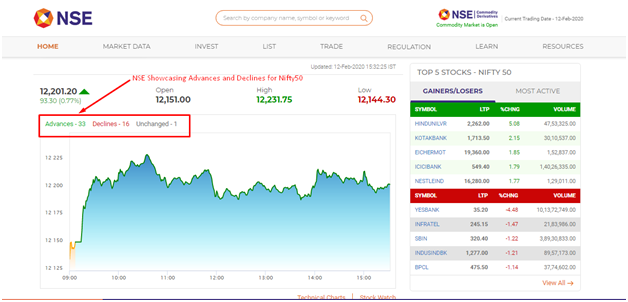
Advances and declines is a word that is used quite extensively in the stock market. Advance and declines are associated with the stock movement and how the indices behave based on those movements. India has two stock exchanges in the form of the National Stock Exchange (NSE) and Bombay Stock Exchange (BSE) where various companies are listed. These stock exchanges constitute various stock market indices that tend to showcase the trend of the market. This is where advances and declines play a vital part.
But what exactly are advances and declines? Simply put as it looks at the number of stocks that close at higher and lower price range the earlier day. But that’s not all as there’s much to it. So off we’re here to look at the advances and declines and its significance in NSE and BSE down below. Read along.
What are Advances & Declines in the Stock Market?
Advances & Declines both have different terminology but define the stock market and its trend. Advances refer to the number of stocks or companies which increased in price from their last closing price while declines refer to the number of stocks or companies which decreased in price from their last closing price. This is often part of the technical analysis as it helps provide the basis for plenty of technical indicators and their performance.
Advances and declines help to analyze the stock market, predict trends and more. The advances and declines is an essential factor in the stock market price analysis as they help to provide the patterns. There are different technical indicators based on advances and declines which help to quantify the indices. Advances and declines and its movement is further illustrated by the advance-decline ratio or say A/D ratio. Let’s find out more about the A/D ratio down below.
What is the A/D ratio?
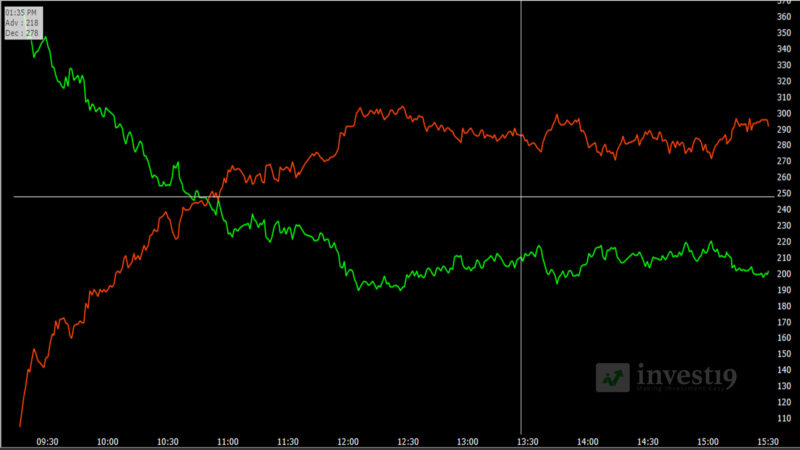
The advance-decline ratio is a market breadth indicator and is computed as a number of stocks that are at a higher price upon the number of stocks that are at a lower price. The frequency of measure may vary from few minutes to hours or days and more depending upon the requirement. It indicates whether the market sentiment is hovering in a positive direction or the negative stance and sheds light on investors alike in their decision to invest in the market.
For say, the A/D Ratio is 2:1 then mathematically if we look at the indices and interpret it accordingly, for every 1 stock that declined the previous day, there were 2 stocks which inclined. Staking this claim, an A/D ratio of more than one means that the market has a positive sentiment going around while the ratio of fewer than 1 means that the market is hovering at a negative stance.
There’s also an ADI known as Advance-Decline Index which takes a look at the advancing and declining securities within any index. It’s also part of the technical analysis and is used along by plenty of traders and investors.
Significance of Advances and Declines
Advances and declines is a major basis of technical analysis and are used in unison along with a host of other indicators. These can be used to interpret the market conditions and showcase whether it’s a bullish or a bearish market. If the value is on the rise then the market will tend to move towards positive sentiment and be likely bullish in nature and vice versa for bearish one.
The indices like Nifty50, BSE Sensex and more showcase the statistical change in the stock market. Merely going by the rise in the index doesn’t always give a clear idea of the market. It’s these ratios like A/D ratio and more which helps to provide the broad strength of the market because an investor can look through the actual stance of the market and see whether it’s fruitful to invest in the industry or not. Advances and declines help to gauze the market properly and help to define if the market is oversold or undersold which makes it a vital tool for any stock market enthusiast and investors alike. It allows investors an idea of the current status of the market and also the future projections and expectations regarding the market.
Note: All information & data provided in this article is for the educational purpose as well as to give general information on the investment, not to provide any professional advice or service. Views & opinions are not biased against the company and do not affect any official policy or any other agency, an organization within the content.