
Investors must be aware with long history of Glenmark pharmaceuticals in the Indian equity market. This time its API (Active Pharmaceuticals Ingredients) arm Glenmark Life Science is going to list on the Indian bourses. The IPO of Glenmark Life Sciences is the 5th IPO in July after G R Infraprojects, Clean Science & Technology, Zomato and Tatva Chintan Pharma. Net proceeds from the IPO will be directed to pay business purchase consideration as Glenmark Life Sciences got some manufacturing facilities and assets from parent company Glenmark in 2018 and became a subsidiary.
Glenmark Life Sciences IPO Details
- Issuer Company: Glenmark Life Sciences Ltd.
- Industry: Pharmaceuticals
- IPO Size: 1,513.60 cr.
- Price Band: 695-720
- Issue Open Date: 27 July, 21
- Issue Close Date: 29 July, 21
- Listing Date: 06 Aug, 21
- Minimum Lot Size: 20 shares
- Face Value: 2 Rs. Per share
- Employee Discount: NA
- Retail Allocation: 35%
- Listing Exchange: NSE, BSE
Composition of Issue Size
The issue size of 1,513.6 cr. is a mix of fresh issue of Rs. 1,060 cr. and offer for sale of Rs. 453.6 cr. at the upper price band.
Offer for Sale: The object of the Offer for Sale is to allow the shareholders to sell an aggregate of up to 6.3 million equity Shares held by them amounting at Rs. 453.60 cr. The company will not receive any proceeds from the Offer for Sale.
Fresh Issue: The company has planned to raise fresh capital comprising an aggregate of 1,47,22,222 equity shares having Face Value ₹2 aggregating up to Rs. 1,060 Cr at the upper price band of Rs. 720. Out of the net proceeds
- An amount of Rs. 800 cr. will be allocated for payment of outstanding purchase consideration to the promoter for the spin-off of the API business from the promoter into the Company pursuant to the Business Purchase Agreement dated October 9, 2018.
- An amount of Rs. 152.76 cr. will be utilized for funding capital expenditure requirements.
- Rest will be utilized for general corporate purpose.
About the Company
Glenmark Life Sciences is a wholly-owned subsidiary of Glenmark Pharmaceuticals Ltd. after it acquired 100% equity interest on July 10, 2018. On January 1, 2019, the API business of Glenmark comprising of manufacturing facilities, movable assets, intellectual property, employees and all the liabilities attributable to the API business was spun off into our Company (the “Spin-off”).
The API firm of Glenmark is a leading developer and manufacturer of select high value, non-commoditized active pharmaceutical ingredients (“APIs”) in chronic therapeutic areas, including cardiovascular disease, central nervous system disease, pain management and diabetes. The company also manufactures and sells APIs for gastro-intestinal disorders, anti-infectives and other therapeutic areas. The API portfolio comprises specialized and profitable products, including niche and technically complex molecules. The firm has strong market share in select specialized APIs such as Telmisartan (anti-hypertensive), Atovaquone (anti-parasitic), Perindopril (antihypertensive), Teneligliptin (diabetes), Zonisamide (CNS) and Adapalene (dermatology). The company is increasingly providing contract development and manufacturing operations services to a range of multinational and specialty pharmaceutical companies.
Must Read: G R Infra and Clean Science IPO have a bumper listing. What investors should do now?
Industry Growth Drivers
- Global formulation market was estimated to be around US$1,144 billion in 2020 and is expected to grow at a CAGR (2021–2026) of 3.4% to reach to about US$1,398 billion by 2026.
- In the global market, innovator formulations sales was around US$861.3 billion in 2020 and it is expected to grow at a CAGR of 3.5% from 2021 to 2026.
- Global API (Active Pharmaceuticals Ingredients) market was estimated to be around US$181.3 billion in 2020 and is expected to grow at a CAGR of 6.2% to reach to about US$259.3 billion by 2026.
- India imports nearly 68% of API, by value, from China but supply may disrupt due to China’s “Blue Skies” policy implementation (2018) and COVID-19 pandemic.
- Indian Government has taken a lot of initiatives to push API industry such as ‘Make In India’ program and ‘Productivity Linked Incentives (PLI)’ Scheme.
- Establishment of an API manufacturing facility in India takes two-fifth of the total cost incurrent in establishing similar facility in western countries. This will make our production cheaper.
- India accounts highest number of USFDA-approved API facilities.
Peers Comparison
The company will face tough competition from Divis Laboratories, Lauras Labs, Shilpa Medicare, Aarti Drugs and Solara Active Pharma Sciences.
Listed peers have been the top performers from last year. All stocks have delivered 2-3 times returnto the investors. Out of the listed peers, Divis Lab has the highest market capitalization followed by Laurus Lab, Aarti Drugs, Solara Active Pharma and Shipla Medicare. Divis Lab has been one the consistent compounder for the investors in last five years.
Financials
Disaggregation of revenue as per geographical areas (Rs. in millions)
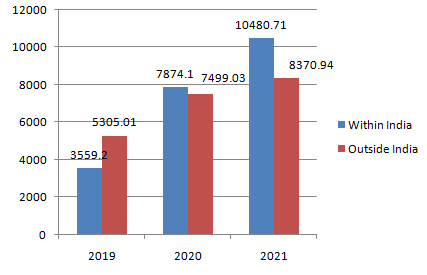
Observations
- In 2019, company was generating more revenues outside India while in the last two years company has increased its dependency for revenue on Indian market.
- Revenues from ‘Within India’ have grown at 71.62% in last two years.
- While, revenues ‘Outside India’ have grown at 25.61% only since 2019.
Financial Statements
| Income Statement (In Millions) | FY21 | FY20 | FY19 |
| Gross Operating Income | 18859.76 | 15493.03 | 8868.65 |
| Cost of Employee & Inventory | 10546.28 | 8327.38 | 4585.78 |
| Other Expenses | 2394.63 | 2326.15 | 1801.23 |
| EBITDA | 5918.85 | 4839.5 | 2481.64 |
| Depreciation | 333.94 | 293.68 | 192.62 |
| Interest | 875.47 | 335.15 | 6.05 |
| Profit Before Tax | 4709.44 | 4210.67 | 2282.97 |
| Tax | 1193.63 | 1079.69 | 327.05 |
| Profit After Tax | 3515.81 | 3130.98 | 1955.92 |
- Company has delivered a growth in revenues by 45.8% in last two years.
- EBITDA margins of the company stood at 31.38%.
- Company is debt-free while its interest payments were for business purchase consideration.
- Company has positive cash flows at Rs. 115.6 cr. and able to fund their working capital requirements smoothly.
- More than 60% of total cost is allocated to cost of raw materials.
- Return on Equity or Net Worth is 46.71%.
- Considering the upper price band at Rs. 720 and FY21 Earning Per Share (EPS) of Rs. 32.61, the company is demanding a P/E multiple of 22.07x, much lower than the Industry P/E of 39.88x.
Also Read: Tatva Chintan Pharma will hit the primary market on July 16. Should you subscribe?